


")


 March 2024 – Primary School Exam")

 MARCH 2024")
, March 2024")
, March 2024")


 March 2024")
 – All Subjects")
 Joining Instruction & Courses Offered | Apply Now")


")
Manufacturing Account
Difference in Accounting for Stocks between Manufacturing Companies and Merchandising Companies
Explain the difference in accounting for stocks between manufacturing companies and merchandising companies
The businesses which produce and sell the items prepare the following accounts at the end of its accounting year:-
- The Manufacturing account (to calculate the total cost of production)
- The Trading and profit & loss account (to find out the net profit or loss)
- The balance sheet.(to show the financial position of the business)
The total cost of production = Prime cost + Factory overhead
The Prime cost = Direct material + Direct labour + Direct expenses
Direct
material cost = Opening stock of raw materials + purchase of raw
materials + carriage inwards – returns outwards – closing stock of raw
materials.
material cost = Opening stock of raw materials + purchase of raw
materials + carriage inwards – returns outwards – closing stock of raw
materials.
Factory overhead expenses = All expenses related to the factory (indirect expenses)
The format of a manufacturing account
Manufacturing account for the year ended . . . . . . . . . . . . . . . . . . . . . . . . . . . . . . . . . . . .
| Opening stock of raw materials | xxxx | |
| Add purchase of raw materials | xxxxx | |
| Add carriage inwards ( if any ) | Xxxx | |
| Xxxxx | ||
| Less Returns outwards (of raw materials) | xxxx | |
| Xxxxx | ||
| Less Goods drawings ( if any ) | xxxx | |
| xxxxx | ||
| Less Closing stock of raw materials | xxxx | |
| Cost of Direct Materials | xxxxxxx | |
| Add Direct labour | xxxxxxx | |
| Add Direct expenses (Eg: royalties) | xxxxxxx | |
| Prime Cost | xxxxxxx | |
| Add Factory overhead expenses | ||
| Factory lighting | xxxxxx | |
| Factory heating | xxxxxx | |
| Factory insurance | xxxxxx | |
| Factory rent | xxxxxx | |
| Factory maintenance | xxxxxx | |
| Factory indirect wages | xxxxxx | |
| Factory supervisor’s wages | xxxxxx | ( + ) |
| Depreciation on plant & machinery | xxxxxx | |
| Depreciation on factory building | xxxxxx | |
| Depreciation on factory furniture | xxxxxx | |
| Depreciation on factory motor van | xxxxxx | |
| Depreciation on other factory fixedassets | xxxxxx | XXXXXXX |
| XXXXXXX | ||
| Add Opening stock of work in progress | xxxxxx | |
| XXXXXXX | ||
| Less Closing stock of work in progress | xxxxxx | |
| Cost of production | XXXXXXX |
The Three Basic Types of Manufacturing Cost
Describe the three basic types of manufacturing cost
Manufacturing costs are the costs necessary to convert raw materials into products. Allmanufacturing costsmust
be attached to the units produced for external financial reporting
under USGAAP. The resulting unit costs are used forinventory valuationon
the balance sheet and for the calculation of thecost of goods soldon
the income statement.
be attached to the units produced for external financial reporting
under USGAAP. The resulting unit costs are used forinventory valuationon
the balance sheet and for the calculation of thecost of goods soldon
the income statement.
Manufacturing costs are typically divided into three categories:
- Direct materials.
This is the cost of the materials which become part of the finished
product. For example, the cost of wood is a direct material in the
manufacture of wooden furniture. - Direct labor.
This is the cost of the wages of the individuals who are physically
involved in converting raw materials into a finished product. For
example, the wages of the person cutting wood into the specified lengths
and the wages of the assemblers are direct labor costs in a furniture
factory. - Factory overhead ormanufacturing overhead.
Factory overhead refers to all other costs incurred in the
manufacturing activity which cannot be directly traced to physical units
in an economically feasible way. The wages of the person who inspects
the completed furniture and thedepreciationon the factory equipment are
part of the factory overhead costs. Factory overhead is also described
as indirect manufacturing costs.
Difference between Indirect and Direct Manufacturing Costs
Distinguish between indirect and direct manufacturing costs
When
you’re determining the price of a product, it’s obvious that you need
to charge more than the total cost of producing it. But production costs
go beyond the materials and equipment — you also need to factor in
workers’ salaries, marketing campaigns, overall company maintenance, and
the like. Taken all together, these expenses make up the direct and
indirect costs of running your business.
It
is easy to classify the basic difference between direct and indirect
costs. Direct costs are immediately associated with the production of a
product or service, while indirect costs include such things as rent —
which may be associated with many products — or they may be several
steps back in the production process. Though it is tempting to ignore
the nuances of this accounting principle, spending some time correctly
allocating your costs can improve your accounting ledger — and your
clout with potential investors.
Direct costs
Direct
costs are expenses that a company can easily connect to a specific
“cost object,” which may be a product, department or project. This
includes items such as software, equipment, labor and raw materials. If
your company develops software and needs specific pregenerated assets
such as purchased frameworks or development applications, those are
direct costs.
Labor
and direct materials, which are used in creating a specific product,
constitute the majority of direct costs. For example, to create its
product, an appliance maker requires steel, electronic components and
other raw materials.
and direct materials, which are used in creating a specific product,
constitute the majority of direct costs. For example, to create its
product, an appliance maker requires steel, electronic components and
other raw materials.
Companies
typically track the cost of the finished raw materials as a direct
cost. Two popular ways of tracking these costsinclude last in, first out
(LIFO) or first in, first out (FIFO).
typically track the cost of the finished raw materials as a direct
cost. Two popular ways of tracking these costsinclude last in, first out
(LIFO) or first in, first out (FIFO).
While
salaries tend to be a fixed cost, direct costs are frequently variable.
Variable expenses increase as additional units of a product or service
are created, whereas an employee’s salary remains constant throughout
the year. For example, smartphone hardware is a direct, variable cost
because its production depends on the number of units ordered.
Indirect costs
Indirect
costs go beyond the costs associated with creating a particular product
to include the price of maintaining the entire company. These overhead
costs are the ones left over after direct costs have been computed, and
are sometimes referred to as the “real” costs of doing business.
costs go beyond the costs associated with creating a particular product
to include the price of maintaining the entire company. These overhead
costs are the ones left over after direct costs have been computed, and
are sometimes referred to as the “real” costs of doing business.
The
materials and supplies needed for the company’s day-to-day operations
are examples of indirect costs. These include items such as cleaning
supplies, utilities, office equipment rental, desktop computers and cell
phones. While these items contribute to the company as a whole, they
are not assigned to the creation of any one service.
Indirect
labor costs make the production of cost objects possible, but aren’t
assigned to a specific product. For example, clerical assistants who
help maintain the office support thecompany as a whole instead of just
one product line. Thus, their labor can becounted as an indirect cost.
labor costs make the production of cost objects possible, but aren’t
assigned to a specific product. For example, clerical assistants who
help maintain the office support thecompany as a whole instead of just
one product line. Thus, their labor can becounted as an indirect cost.
Other
common indirect costs include advertising and marketing, communication,
“fringe benefits” such as an employee gym, and accounting and payroll
services.
common indirect costs include advertising and marketing, communication,
“fringe benefits” such as an employee gym, and accounting and payroll
services.
Much
like direct costs, indirect costs can be both fixed and variable. Fixed
indirect costs include things like the rent paid for the building in
which a company operates. Variable costs include the ever-changing costs
of electricity and gas.
like direct costs, indirect costs can be both fixed and variable. Fixed
indirect costs include things like the rent paid for the building in
which a company operates. Variable costs include the ever-changing costs
of electricity and gas.
Difference between Product Costs and Period Costs
Distinguissh between product costs and period costs
The
key difference between product costs and period costs is that products
costs are only incurred if products are acquired or produced, and period
costs are associated with the passage of time. Thus, a business that
has no production or inventory purchasing activities will incur no
product costs, but will still incur period costs.
Examples
of product costs are direct materials, direct labor, and allocated
factory overhead. Examples of period costs are general and
administrative expenses, such as rent, office depreciation, office
supplies, and utilities.
of product costs are direct materials, direct labor, and allocated
factory overhead. Examples of period costs are general and
administrative expenses, such as rent, office depreciation, office
supplies, and utilities.
Product
costs are sometimes broken out into the variable and fixed
subcategories. This additional information is needed when calculating
the break even sales level of a business. It is also useful for
determining the minimum price at which a product can be sold while still
generating a profit.
costs are sometimes broken out into the variable and fixed
subcategories. This additional information is needed when calculating
the break even sales level of a business. It is also useful for
determining the minimum price at which a product can be sold while still
generating a profit.
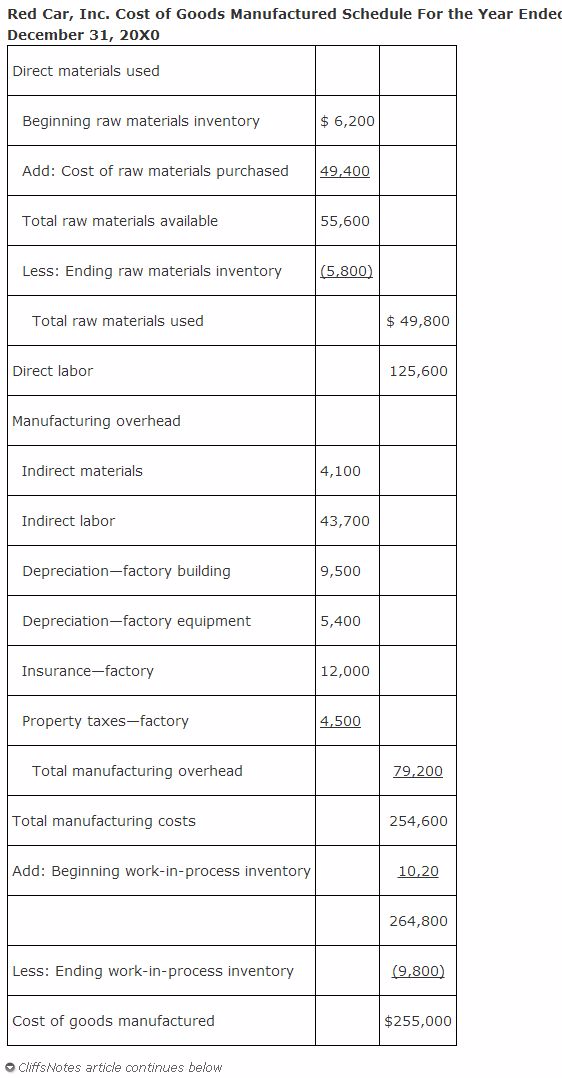
A Schedule of Cost of Finished Goods Manufactured
Prepare a schedule of cost of finished goods manufactured
Thecost
of goods manufactured scheduleis used to calculate the cost of
producing products for a period of time. The cost of goods manufactured
amount is transferred to the finished goods inventory account during the
period and is used in calculating cost of goods sold on the income
statement. The cost of goods manufactured schedule reports the total
manufacturing costs for the period that were added to work‐in‐process,
and adjusts these costs for the change in the work‐in‐process inventory
account to calculate the cost of goods manufactured.
The
cost of goods manufactured for the period is added to the finished
goods inventory. To calculate the cost of goods sold, the change in
finished goods inventory is added to/subtracted from the cost of goods
manufactured
cost of goods manufactured for the period is added to the finished
goods inventory. To calculate the cost of goods sold, the change in
finished goods inventory is added to/subtracted from the cost of goods
manufactured
The Cost of Work in Process Stocks and the Costs of Finished Goods Stocks
Determine the cost of work in process stocks and the costs of finished goods stocks
Work
in process is goods in production that have not yet been completed.
These goods are situated between raw materials and finished goods in the
production process flow.
in process is goods in production that have not yet been completed.
These goods are situated between raw materials and finished goods in the
production process flow.
Inventory
in this classification typically involves the full amount of raw
materials needed for a product, since that is usually included in the
product at the beginning of the manufacturing process. During
production, the cost of direct labor and overhead is added in proportion
to the amount of work done. From the perspective of valuation, a WIP
item is more valuable than a raw materials item (since processing costs
have been added), but is not as valuable as a finished goods item (to
which the full set of processing costs have already been added).
In
prolonged production operations, there may be a considerable amount of
investment in work in process. Conversely, the production of some
products occupies such a brief period of time that the accounting staff
does not bother to track WIP at all; instead, the items in production
are considered to still be in the raw materials inventory. In this
latter case, inventory essentially shifts directly from the raw
materials inventory to the finished goods inventory, with no separate
work in process accounting at all.
Work
in progress accounting involves tracking the amount of WIP in inventory
at the end of an accounting period and assigning a cost to it for
inventory valuation purposes, based on the percentage of completion of
the WIP items.
in progress accounting involves tracking the amount of WIP in inventory
at the end of an accounting period and assigning a cost to it for
inventory valuation purposes, based on the percentage of completion of
the WIP items.
WIP
accounting can be incredibly complex for large projects that are in
process over many months. In those situations, we use job costing to
assign individual costs to projects. See thejob costingarticle for more
information.
accounting can be incredibly complex for large projects that are in
process over many months. In those situations, we use job costing to
assign individual costs to projects. See thejob costingarticle for more
information.
In
situations where there are many similar products in process, it is more
common to follow these steps to account for work in progress inventory:
situations where there are many similar products in process, it is more
common to follow these steps to account for work in progress inventory:
- Assign raw materials.
We assume that all raw materials have been assigned to work in process
as soon as the work begins. This is reasonable, since many types of
production involve kitting all of the materials needed to construct a
product and delivering them to the manufacturing area at one time. - Compile labor costs.
The production staff can track the time it works on each product, which
is then assigned to the work in process. However, this is painfully
time-consuming, so a better approach is to determine the stage of
completion of each item in production, and assign a standard labor cost
to it based on the stage of completion. This information comes from
labor routings that detail the standard amount of labor needed at each
stage of the production process. - Assign overhead. If
overhead is assigned based on labor hours, then it is assigned based on
the labor information compiled in the preceding step. If overhead is
assigned based on some other allocation methodology, then the basis of
allocation (such as machine hours used) must first be compiled. - Record the entry.
This journal entry involves shifting raw materials from the raw
materials inventory account to the work in process inventory account,
shifting direct labor expense into the work in process inventory
account, and shifting factory overhead from the overhead cost pool to
the WIP inventory account.
It
is much easier to usestandard costsfor work in process accounting.
Actual costs are difficult to trace to individual units of production,
unless job costing is being used. However, standard costs are not as
precise as actual costs, especially if the standard costs turn out to be
inaccurate, or there are significant production inefficiencies beyond
what were anticipated in the standard costs.
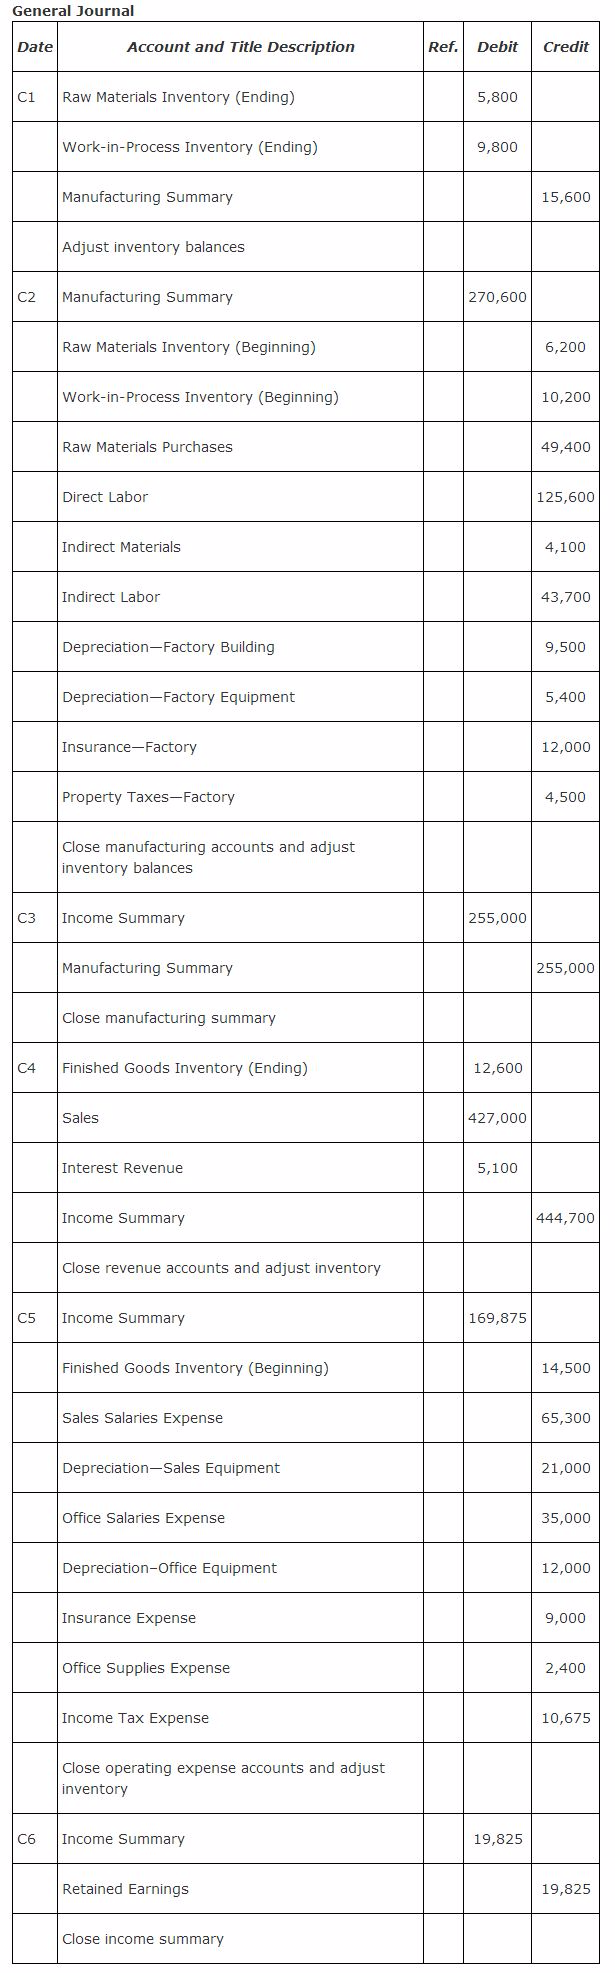
Closing Entries for a Manufacturing Company
Prepare closing entries for a manufacturing company
Some
companies use one account, factory overhead, to record all costs
classified as factory overhead. If one overhead account is used, factory
overhead would be debited in the previous entry instead of factory
depreciation.
companies use one account, factory overhead, to record all costs
classified as factory overhead. If one overhead account is used, factory
overhead would be debited in the previous entry instead of factory
depreciation.
At
the end of the cycle, the closing entries are prepared. For a
manufacturing company that uses the periodic inventory method, closing
entries update retained earnings for net income or loss and adjust each
inventory account to its period end balance. A special account called
manufacturing summary is used to close all the accounts whose amounts
are used to calculate cost of goods manufactured. The manufacturing
summary account is closed to income summary. Income summary is
eventually closed to retained earnings. The manufacturing accounts are
closed first. The closing entries that follow are based on the accounts
included in the cost of goods manufactured schedule and income statement
for Red Car, Inc.
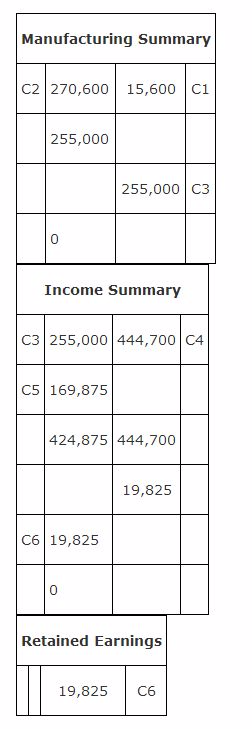
The following T‐accounts illustrate the impact of the closing entries on the special closing accounts and retained earnings.
The Basic Differences in the Financial Statements of Manufacturing Companies and Merchandising Companies
Describe the basic differences in the financial statements of manufacturing companies and merchandising companies
The
most significant difference between a manufacturing company and a
merchandising business is that a manufacturer makes goods to sell and a
merchandiser buys or acquires goods for resale. In developing a small
business, it is critical to understand whether your strengths, available
resources and environmental factors contribute to a manufacturing or
merchandising setup.
- Expertise:
Given their primary functions of either making or acquiring goods for
resale, expertise is a core difference between manufacturing and
merchandising. A successful manufacturing business features expertise in
developing an operation that produces high-quality, efficient or
high-value goods and then distributing them. A merchandiser owns
strengths in acquiring goods, increasing their value and marketing them
to buyers. A distributor buys items and then resells to retailers,
consumers or business buyers. A retailer buys goods and then resells to
consumers. - Relationship: Manufacturers and
merchandisers also have different roles in their interrelationship
within a traditional distribution channel. The distribution or trade
channel represents the flow of goods from manufacturer through
distribution, retailer and on to the final customer. The manufacturer
makes goods and traditionally sells them to the distributor or retailer.
Wholesaling merchandisers are the traditional direct buyer of
manufacturers, although retailers may buy directly from manufacturers as
well. - Marketing Strategies: Manufacturers
typically use a combination of “push” and “pull” marketing strategies.
Pull marketing occurs when the manufacturer promotes its brands to end
customers. The idea it to create market demand and pull the products
through the distribution process. Push marketing occurs when a
manufacturer promotes goods directly to trade buyers, or merchandisers.
This includes a mix of communicating benefits and offering trade
incentives or discounts. Retailer merchandising businesses focus on
promoting their company and product brands to targeted customers. They
must attract customers to make sales. - Inventory:
For manufacturers, production inventory includes raw materials used in
producing finished goods. Low costs and efficient use of raw inventory
is key in manufacturing profitability. Once raw materials are converted,
the manufacturer possesses a finished-goods inventory. A reseller buys
finished goods and either holds its new inventory in a distribution
center or in storage areas in stores. When floor inventory or
merchandise grows low, stock is replenished by retail associates.
The procedure Inherent in a General Accounting System for a Manufacturing Company
Describe the procedure inherent in a general accounting system for a manufacturing company
Understanding the JD Edwards EnterpriseOne Manufacturing Accounting System
This two-part flowchart illustrates the manufacturing accounting processes:
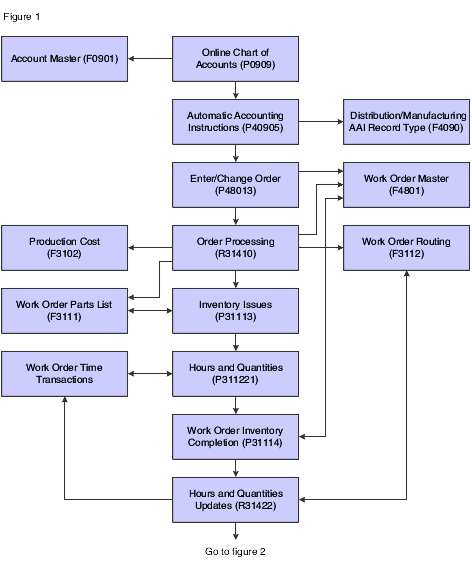

Manufacturing Accounting process flow
Integration with General Accounting
To
remain competitive in a changing business environment, companies must
integrate all aspects of their operations. This integration includes
identifying operations that reduce lead times, expedite speed-to-market,
and reduce operating costs. The objective is to reduce costs to remain a
competitive market player.
After
a company defines item costs and identifies how each cost is derived,
it transfers these cost records into the accounting records. Using a
manufacturing accounting system enables you to track the costs that are
associated with each activity within the manufacturing process. As
material is received into inventory, issued to a manufacturing order,
and used at various stages of the manufacturing cycle, the company
maintains detailed accounting records that reflect debits and credits to
predetermined financial accounts. These records can be transferred to
the general ledger throughout the manufacturing cycle.
The
ability to perform standard costing (comparisons based on frozen costs)
or actual costing (comparison of expected cost versus actual cost)
enables companies to accurately account for the cost of manufacturing.
Comparisons identify specific costs that deviate from the original cost
expectations. This information enables managers to make better informed
decisions and to implement a course of action that reflects current
costs in the ultimate cost of the products. Work in process and on-hand
inventory can be revalued to reflect these updated costs.
In
volatile and dynamic industries such as electronics and other
technologies, changes in technology and customer demand, product
configuration, and production processes must be monitored constantly.
Changes must be integrated and reflected throughout product life cycles
as quickly as possible. Industries remain competitive in the global
marketplace only if they minimize the time to market for new products
and reduce costs.
This
flowchart illustrates the interaction between the JD Edwards
EnterpriseOne Manufacturing Accounting system and the JD Edwards
EnterpriseOne General Accounting system:
flowchart illustrates the interaction between the JD Edwards
EnterpriseOne Manufacturing Accounting system and the JD Edwards
EnterpriseOne General Accounting system:

Integration between Manufacturing Accounting and General Accounting systems
Different Accounts that Appear on a Manufacturing Company’s Books
List the different accounts that appear on a manufacturing company’s books
The balance sheet is a snapshot of a company’s:
- assets(what it owns)
- liabilities(what it owes)
- owners’ equity(net worth – what’s left over for the owners)
The
balance sheet shapshot is at a particular point in time, such as at the
close of business on December 31. The simplest corporate balance sheet
possible, showing only totals and leaving out all detail, might look
like this.
balance sheet shapshot is at a particular point in time, such as at the
close of business on December 31. The simplest corporate balance sheet
possible, showing only totals and leaving out all detail, might look
like this.
| ALBEGA CORPORATIONBalance SheetDecember 31, 20xx | |||
| Assets | $485,000 | Liabilities | $ 285,000 |
| Shareholders’ Equity | $200,000 | ||
| Total Assets | $485,000 | Total Liabilities and Shareholders’ Equity | $485,000 |
Balance sheet equation.Assets
are always equal to the liabilities plus equity. You can see the
balance sheet as a statement of what the company owns (assets) and the
persons having claims to the assets (creditors and owners). Here is the
balance sheet equation:
are always equal to the liabilities plus equity. You can see the
balance sheet as a statement of what the company owns (assets) and the
persons having claims to the assets (creditors and owners). Here is the
balance sheet equation:
| Assets = Liabilities + Shareholders’ Equity | |
| Assets | Liabililities |
| Shareholders’ Equity | |
The
equation reflects how information is organized on the balance sheet,
with assets listed on the left and liabilities and equity on the right.
Like the equation, the two sides of the balance sheet must balance.
equation reflects how information is organized on the balance sheet,
with assets listed on the left and liabilities and equity on the right.
Like the equation, the two sides of the balance sheet must balance.
Double entry bookkeeping.The
balance sheet equation also reflects the way information is recorded in
the company records. Too keep the equation in balance, company
transactions are recorded using “double entry bookkeeping.” Every
transaction will cause two changes on the accounting statements — that
is, a transaction that affects one side of the equation will also affect
the other side, unless there are two offsetting entries on one side.
For example, a $2,000 increase in assets will also result in either:
- an offsetting decrease in assets (if the new $2,000 asset was purchased with $2,000 cash)
- an increase in liabilities (if the company borrowed the $2,000 to buy the asset)
- an increase in equity (if the $2,000 came from contributions by the company’s owners).
Reading balance sheet.Let’s read a more detailed version of our balance sheet:
| ALBEGA CORPORATIONBalance SheetDecember 31, 20xx | |||
| ASSETS | LIABILITIES | ||
| Current Assets | Current Liabilities | ||
| Cash | $ 50,000 | Accounts Payable | $ 60,000 |
| Accounts receivable (net of allowance for bad debts of $5,000) | $175,000 | Notes payable (including current portion of long-term debt) | $ 40,000 |
| Inventory (FIFO) | $125,000 | Income taxes payable | $ 25,000 |
| Total current assets | $350,000 | Total current liabilities | $125,000 |
| Non-current Assets | Long Term Liabilities | ||
| Plant | $ 50,000 | 5-year notes payable | $160,000 |
| Property | $ 75,000 | Total Liabilities | $285,000 |
| Equipment | $ 50,000 | ||
| Fixed assets | $175,000 | SHAREHOLDERS’ EQUITY | |
| Less: Accumulated depreciation | ($ 50,000) | Common stock ($1.00 par value; 1,000 shs authorized, issued + outstanding) | $ 1,000 |
| Net fixed assets | $125,000 | Paid-in capital in excess of par value | $ 49,000 |
| Intangibles (patents) | $ 10,000 | Retained earnings | $150,000 |
| Total non-current assets | $ 135,000 | Total Shareholders’ Equity | $200,000 |
| Total Assets | $485,000 | Total Liabilities and Shs’ Equity | $485,000 |
What the Accounts in a Manufacturing Company’s Books Represent
State what the accounts in a manufacturing company’s books represent
Assets
The
assets accounts show how the company has used the money it has obtained
from lenders, investors, and company earnings. Technically, according
to GAAP, assets are resources with “probable future economic benefits
obtained or controlled by an entity resulting from pasttransactionsor
events.” This leads to some non-intuitive results. Importantresources
like intellectual property or longstanding business relationships,
though valuable to a business, are generally not reflected on the
balance sheet.
Assets
are grouped as monetary (cash and accounts receivables), liquid
(whether they can easily be converted to cash), tangible or intangible.
are grouped as monetary (cash and accounts receivables), liquid
(whether they can easily be converted to cash), tangible or intangible.
In our example the asset categories are:
- Current assets:cash and those items, such as accounts receivable, that are normally expected to be converted into cash within one year.
- Non-current assets:Fixed
assets: the company’s more or less permanent physical assets, such as
its land, buildings, machinery and equipment; Intangible assets:
goodwill, trademarks, copyrights, patents (reader beware!)
Current Assets
Cash.
– This includes not only currency, which a company might keep in “petty
cash,” but also bank deposits, U.S. Treasury notes, money market
accounts, and other “cash equivalents.” If the company had to pay a
ransom, how much could it pay today?
– This includes not only currency, which a company might keep in “petty
cash,” but also bank deposits, U.S. Treasury notes, money market
accounts, and other “cash equivalents.” If the company had to pay a
ransom, how much could it pay today?
Accounts Receivable.
– If a company sells goods or services on credit, the amounts owed to
the company by customers are “accounts receivable.” The company must,
however, anticipate that some of the accounts receivable will not be
received. An account, such as “allowance for bad debts,” is set-off
(subtracted) from the accounts receivable shown in the balance sheet.
The allowance, often based on a percentage, is usually based on the
company’s past collection experience. This presents a fairer picture of
how much the company will likely receive from its sales on credit.
Inventory.
– For a manufacturing company, inventory includes goods used in the
business at various stages of production: raw materials, work in process
and finished goods. Other companies have other types of inventory. For
example, a retail store has in inventory only the purchased goods it
sells. Service companies have no inventory. The generally accepted
method of inventory valuation is to record the inventory at its cost or
market value, whichever is lower (here “market value” is not retail
value, but what it would cost the company to replace the inventory).
Inventory
Things
get trickier for the cost of goods in various stages of the
manufacturing process. Two common ways to measure the “cost” of
inventory purchased at different times and at varying prices are:
get trickier for the cost of goods in various stages of the
manufacturing process. Two common ways to measure the “cost” of
inventory purchased at different times and at varying prices are:
- First-in, first-out (“FIFO “).
Under the FIFO method of valuation, inventory items purchased first are
deemed to be sold first. Under this method, the most recent purchase
prices are deemed to represent the cost of the items remaining. For
example, suppose that the purchases and sales of a particular item are
as follows:Under FIFO, the cost of the ending inventory (300 items)
would be $250 ($.90 each for 100 and $.80 each for 200). When prices are
rising, FIFO results in inventory being shown on the balance sheet at
the highest possible amount.
| Quantity | Cost per item | Total Cost | |
| Jan. Purchase | 100 | $ .60 | $ 60 |
| Mar. Purchase | 500 | .70 | $350 |
| June Purchase | 300 | .80 | $240 |
| Sep. Purchase | 100 | .90 | $ 90 |
| Total purchases | 1,000 | $740 | |
| Less sales | 700 | ||
| Ending inventory | 300 | ?? | ?? |
- Last-in, first-out (“LIFO “).
Under LIFO, the items of inventory purchased last are deemed to be sold
first — so the cost of the ending inventory is deemed the cost of the
items purchased first. In our example, the cost of the ending inventory
(300 items) would be $200 ($.60 for each 100 items and $.70 each for 200
items)
Non-current Assets – Fixed Assets
Fixed
assets — such as land, buildings, machinery and equipment — are
typically shown on the balance sheet at their cost, less accumulated
depreciation.
assets — such as land, buildings, machinery and equipment — are
typically shown on the balance sheet at their cost, less accumulated
depreciation.
Historical cost.How are assets valued for purposes of the balance sheet? There are several possibilities:
- historical cost (how much the company paid to acquire it)
- current market value
- value in use
- liquidation value based on its sale after use.
Assets are typically recorded on financial statements at theirhistorical costexpressed in dollars.
Depreciation.
What is depreciation / depletion / amortization? these are all terms
that refer to alloocating the cost of along-lived asset to consecutive
accounting periods as expenses until the full cost is fully accounted
for.
What is depreciation / depletion / amortization? these are all terms
that refer to alloocating the cost of along-lived asset to consecutive
accounting periods as expenses until the full cost is fully accounted
for.
- “Depreciation”
describes the allocation of the cost of certain fixed assets over their
estimated useful lives. (Land is not depreciated, since its useful life
for accounting purposes is unlimited.) - “Depletion” describes the case of “wasting assets,” such as oil and gas fields.
- “Amortization”
is used for intangible assets, such as patents or trademarks.
Amortization of R&D expenses is controversial. Under GAAP such
expenses are expensed currently, even though they may have long-term
payoffs.
When
a fixed asset is depreciated, the cost of the asset is allocated over
its expected useful life, and each annual installment of depreciation is
added to an account called “accumulated depreciation. ” On the balance
sheet, accumulated depreciation is set-off against the total fixed
assets (shown at their total cost at time of purchase).
Notice that the balance sheet does not reflect appreciation in the value of assets, such as when there is inflation.
How is depreciation calculated? There are two common methods:
- Straight-line method.–
The straight line depreciation method, the most common, calculates
depreciation by dividing the cost of the asset, less its salvage value,
by its estimated useful life. - Double declining balance method. – The double declining balance method calculates depreciation by takingtwicethe
straight-line depreciation percentage rate and multiplying this
percentage rate by the initial cost of the asset (in the first year) or
by each declining balance amount (in succeeding years). The asset is not
depreciated below a reasonable salvage value.
The double declining balance method is a kind ofaccelerated depreciationsince
it produces more depreciation in the initial years of an asset’s life
than does the straight-line method. For tax
purposesaccelerateddepreciationhas the advantage ofreducing taxable
income during early years of asset;s life — and as we know, tax savings
now are worth more than tax savings later.
it produces more depreciation in the initial years of an asset’s life
than does the straight-line method. For tax
purposesaccelerateddepreciationhas the advantage ofreducing taxable
income during early years of asset;s life — and as we know, tax savings
now are worth more than tax savings later.
Example 1
A
wine press purchased for $50,000 has an estimated useful life of 5
years and a salvage value of $10,000. What is its annual depreciation
using a straight-line method? a double-declining balance method?
wine press purchased for $50,000 has an estimated useful life of 5
years and a salvage value of $10,000. What is its annual depreciation
using a straight-line method? a double-declining balance method?
| Year | Depreciation | Depreciation |
| Straight-line | Double-declining | |
| 1 | (50,000 – 10,000) / 5 = $ 8,000 | 50,000 x 40% = $ 20,000 |
| 2 | (50,000 – 10,000) / 5 = $ 8,000 | (50,000-20,000) x 40% = $12,000 |
| 3 | (50,000 – 10,000) / 5 = $ 8,000 | (30,000-12,000) x 40% = $7,200 |
| 4 | (50,000 – 10,000) / 5 = $ 8,000 | $ 800 |
| 5 | (50,000 – 10,000) / 5 = $ 8,000 | $0 |
| Annual % | 20% | varies |
The annual depreciation using a straight-line method is $8,000 — that is, 20% per year,
The
annual depreciation using a double-declining method varies. After three
years, the cumulative depreciation is $39,200. Assuming a salvage value
of $10,000, the last depreciation amount of $800 comes in the fourth
year when the salvage figure is reached.
annual depreciation using a double-declining method varies. After three
years, the cumulative depreciation is $39,200. Assuming a salvage value
of $10,000, the last depreciation amount of $800 comes in the fourth
year when the salvage figure is reached.
Intangible Assets
This
item has become more important as intellectual property (patents,
trademarks, copyrights) has become the darlings of the information age.
Typically, IP is carried at its acquisition or development cost.
item has become more important as intellectual property (patents,
trademarks, copyrights) has become the darlings of the information age.
Typically, IP is carried at its acquisition or development cost.
Vapor.
But intangible assets, particularly goodwill, raise tricky issues. Are
these unseen, untouchable assets just vapor? On the one hand, it is easy
to overstate their value, particularly since there usually is no ready
market to compare. On the other hand, intangible assets may represent an
importan part of the company’s overall business value. (For example,
some business valuatiors hav calculated that the Coca-Cola trademark —
forget the secret formula — is worth a real $80 billion.) exists
Goodwill.
What about goodwill — that is, the value the business derives from
brand names, reputation, management quality, customer loyalty or
recognized location? Typically, goodwill is not accounted for.
Classified as an intangible asset, goodwill is recorded on a company’s
books only when it is acquired in a business acquisition. Sometimes,
goodwill is valued as the difference between the price paid for a
company as a going concern and the fair market value of its assets minus
liabilities.
Liabilities
The
second portion of the balance sheet consists of the company’s
liabilities — usually separated into current liabilities and long-term
liabilities. Liabilities can be understood as the opposite of assets —
they represent obligations of the business. Not all obligations to make a
payment in the future are reflected on the balance sheet. For example,
an obligation to pay employees’ rising health care costs may be a
signficant commitment , it might not be represented on the balance sheet
if sufficiently uncertain. Or the prospect of paying clean-up fees for a
toxic site owned by the business may not make it to the balance sheet,
though it may be described in a note.
- Current
liabilities: those debts that are to be paid within 12 months. These
include accounts payable, short-term notes payable and income taxes
payable. Also included are accrued expenses payable, such as for
employees wages and salaries, insurance premiums, attorney fees, and
taxes due. - Long-term liabilities: any debt that is not due
within one year, such as long-term debts and notes. In the case of a
debt that is partially due within one year and partially due in future
years, the portion of the debt payable within one year is shown as a
current liability and the rest as a long-term liability.
One
important potential drain on a business are contingent liabilities,
such as possible products liability claims or securities fraud exposure.
These are not carried on the balance sheet.
important potential drain on a business are contingent liabilities,
such as possible products liability claims or securities fraud exposure.
These are not carried on the balance sheet.
Owners’ Equity
The
third and final portion of a balance sheet represents the owners’
equity. In a sole proprietorship (a business with one owner), the
ownership account is known as “proprietor’s equity”; in a partnership,
the ownership account is “partners’ capital.”
third and final portion of a balance sheet represents the owners’
equity. In a sole proprietorship (a business with one owner), the
ownership account is known as “proprietor’s equity”; in a partnership,
the ownership account is “partners’ capital.”
In
a corporation, the ownership accounts are divided into three
categories, reflecting accounting conventions found in state corporation
statutes. Accountants, however, use their own nomenclature for these
accounts [the corporation statutory term in in brackets]
a corporation, the ownership accounts are divided into three
categories, reflecting accounting conventions found in state corporation
statutes. Accountants, however, use their own nomenclature for these
accounts [the corporation statutory term in in brackets]
- Common stock [stated capital].
This is calculated by multiplying the number of shares of stock
outstanding by the par value of each share. In our balance sheet above,
the par value of the corporation’s common stock is $1.00 per share and
1,000 shares have been issued, yielding a stated capital of $1,000. (Par
value is an arbitrary dollar figure assigned to stock to determine
stated capital; some corporation statutes — particularly Delaware’s —
restrict a corporation’s distributions based on stated capital.) - Paid-in capital in excess of par [capital surplus].
This is the difference between what shareholders paid the corporation
for their stock and the stock’s par value. In our example, the
corporation sold 1,000 shares of common stock for $50 each — $1,000
shown in common stock and $49,000 shown in paid-in capital in excess of
par value. (Some corporation statutes also restrict distributions based
on capital surplus). - Retained earnings [earned surplus].
This shows the total profits and losses of the corporation since its
formation, decreased by any dividends paid the shareholders. If the
corporation has had losses rather than profits, retained earnings is
negative (indicated by placing the number in parenthesis). That is, as
the business makes or loses money, this is the item that gets adjust (up
or down) to balance the “balance sheet.”
One
way to see equity is aspermanentnon-debt capitalization of the business
— that is, captal assets and accumulated profitsless
anydistributionsto the owners. Each year the equity account changes with
the ebb and flow of revenuesand expenses — creating a link between
theincome statementand balance sheet.
The Purpose of Manufacturing Account
Explain the purpose of a manufacturing Account
The
purpose of a Manufacturing Account is to ascertain Cost of Production (
).Cost of Production = Prime Cost + Factory Overheads + Opening Work in
Progress – Closing Work in Progress
purpose of a Manufacturing Account is to ascertain Cost of Production (
).Cost of Production = Prime Cost + Factory Overheads + Opening Work in
Progress – Closing Work in Progress
How a Manufacturing Account is Composed
Explain how a manufacturing Accounts is composed
A
manufacturing account shows the cost of producing the goods that are
sold during an accounting period. It is split into the following
sections:
manufacturing account shows the cost of producing the goods that are
sold during an accounting period. It is split into the following
sections:
- Prime cost– Direct costs of physically making the products (e.g. raw materials)
- Overhead cost– Other indirect costs associated with production but not in a direct manner
The
cost of manufacturing the products will be the total of the prime cost
and the overhead cost added together. This total factory cost (or
production cost) will then be transferred to the trading account where
it will appear instead of the ‘normal’ purchases figure.
cost of manufacturing the products will be the total of the prime cost
and the overhead cost added together. This total factory cost (or
production cost) will then be transferred to the trading account where
it will appear instead of the ‘normal’ purchases figure.
Prime cost
The
prime cost covers all the costs involved in physically making the
products and other costs that are directly related to the level of
output. These are usually known as direct costs and common examples
would include:
prime cost covers all the costs involved in physically making the
products and other costs that are directly related to the level of
output. These are usually known as direct costs and common examples
would include:
- Direct materials
- Direct labour/wages
- Other direct costs (e.g. packaging, royalties)
Cost of raw materials consumed
Within
the prime cost adjustments will have to be made for opening and closing
stocks of raw materials. There may also be carriage inwards charged on
the raw materials and returns outwards of materials sent back to their
original supplier. The overall charge for materials is referred to as
cost of raw materials consumed, this should be highlighted when drawing
up a manufacturing account and it is calculated as follows:
| – | Opening stock of raw materials |
| – | Purchases of raw materials |
| Add | |
| Carriage inwards on raw materials | Less |
| Returns outwards of raw materials | |
| Less | Closing stock of raw materials |
| Equals | Cost of raw materials consumed |
A
true direct cost will vary directly with the level of output. If the
output level doubles, then we would expect a direct cost to also double.
If the cost does not behave in this manner then it may be an indirect
cost and not a direct cost.
true direct cost will vary directly with the level of output. If the
output level doubles, then we would expect a direct cost to also double.
If the cost does not behave in this manner then it may be an indirect
cost and not a direct cost.
Royalties
Royalties
is sometimes included within the prime cost. These are a cost that is
paid to the owner of a copyrighted process. Usually a fee is paid for
each product that uses this process and therefore the total royalty cost
will be directly proportional to the level of output.
is sometimes included within the prime cost. These are a cost that is
paid to the owner of a copyrighted process. Usually a fee is paid for
each product that uses this process and therefore the total royalty cost
will be directly proportional to the level of output.
Overhead cost
This
section includes all other expenses concerned with the production of
output but not in a direct manner.This means that if the level of
production increased, then these expenses may also increase but not by
the same proportion. These are sometimes known as indirect costs,
factory overheads or indirect manufacturing costs. Common examples of
overhead costs would include:
- Factory rent
- Indirect labour
- Depreciation of factory plant and equipment
Depreciation
of fixed assets should be included in this section only if it is
depreciation on assets included for production. For example,
depreciation of machinery would appear as an overhead cost but
depreciation of office equipment would appear in the profit and loss
account as an expense as would be expected in a non-manufacturing
organisation.
Once
the overhead costs have been calculated they will need adding to the
total of the prime cost. This will give us the production cost of the
goods. However, the production cost will need adjusting for goods which
are not yet finished.
the overhead costs have been calculated they will need adding to the
total of the prime cost. This will give us the production cost of the
goods. However, the production cost will need adjusting for goods which
are not yet finished.


 PDF")


Enjoyed every bit of your blog post. Keep writing.
Thanks a lot for the blog post.Much thanks again. Want more.
Thank you ever so for you blog.Much thanks again. Cool.
Major thanks for the blog.Thanks Again. Cool.
Really informative blog article.Thanks Again. Really Great.
Looking forward to reading more. Great blog article.Much thanks again. Want more.