TOPIC 1: RELATIONS ~ MATHEMATICS FORM 3
Normally relation deals with matching of elements from the first set called
DOMAIN with the element of the second set called RANGE.
A relation “R” is the rule that connects or links the elements of one set with the elements of the other set.
- “Is a brother of “
- “Is a sister of “
- “Is a husband of “
- “Is equal to “
- “Is greater than “
- “Is less than “
Normally
relations between two sets are indicated by an arrow coming from one
element of the first set going to the element of the other set.
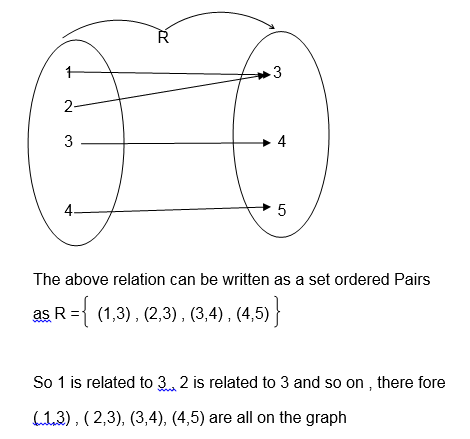
The relation can be denoted as:
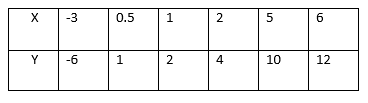
This
is the relation which can be written as a set of ordered pairs {(-3,
-6), (0.5, 1), (1, 2), (2, 4), (5, 10), (6, 12)}. The table shows that
the relation satisfies the equation y=2x. The relation R defining the
set of all ordered pairs (x, y) such that y = 2x can be written
symbolically as:
Find relations between members in a set
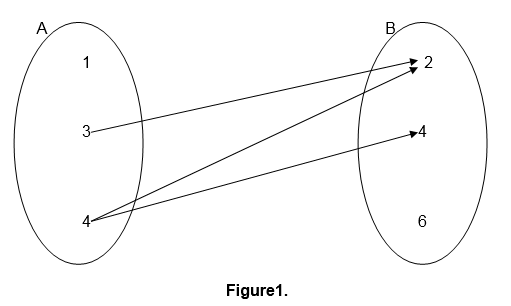
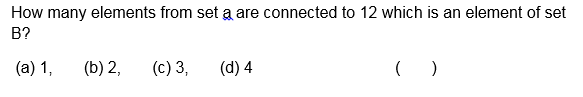
Which of the following ordered pairs belong to the relation {(x, y): y>x}?
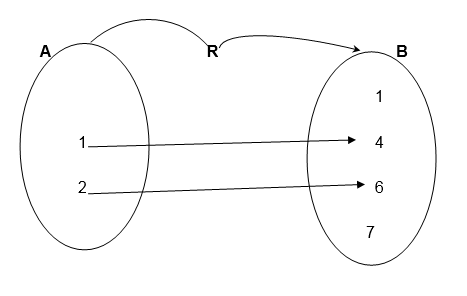
For
example the relation ” is greater than ” involving numbers 1,2,3,4,5
and 6 where 1,3 and 5 belong to set A and 2,4 and 6 belong to set B can
be indicate as follows:-
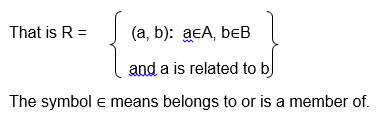
can also be defined in terms of ordered pairs (a,b) for which a is
related to b and a is an element of set A while b is an element of set
B.
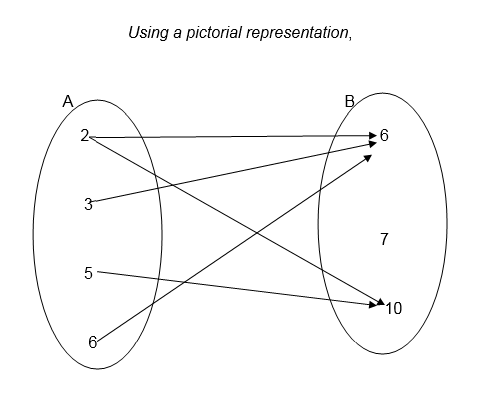
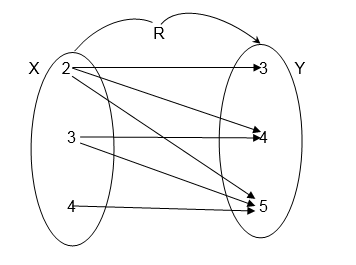
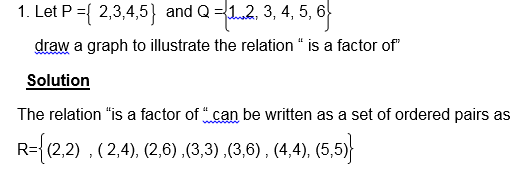
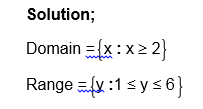
example the relation ” is a factor of ” for numbers 2,3,5,6,7 and 10
where 2,3,5 and 6 belong to set A and 6,7 and 10 belong to set B can be
illustrated as follows:-
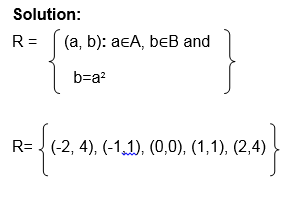
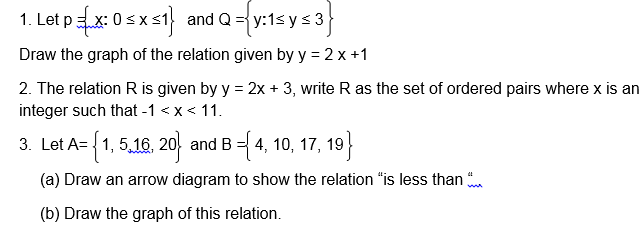
[if !supportLists]–>1. Draw an arrow diagram to illustrate the
relation which connects each element of set A with its square.
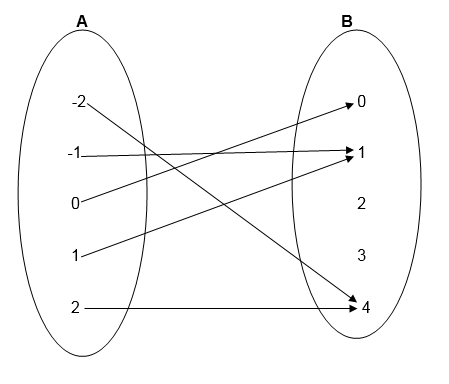
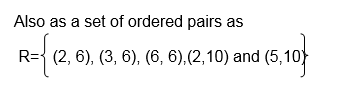
Using
the information given in example 1, write down the relation in set
notation of ordered pairs. List the elements of ordered pairs.
Exercise 1
Let P= {Tanzania, China, Burundi, Nigeria}
A group people contain the following; Paul Koko, Alice Juma, Paul
Hassan and Musa Koko. Let F be the set of all first names, and S the set
of all second names.
Exercise 2
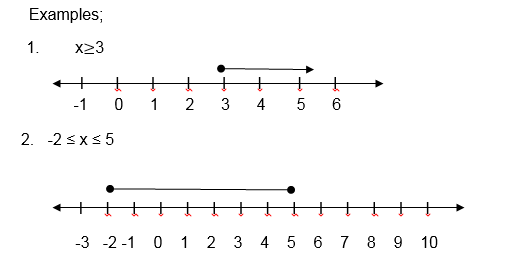
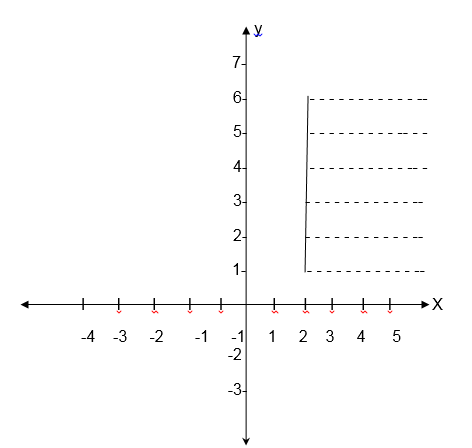
A Graph of a Relation Represented by a Linear Inequality
Draw a graph of a relation represented by a linear inequality
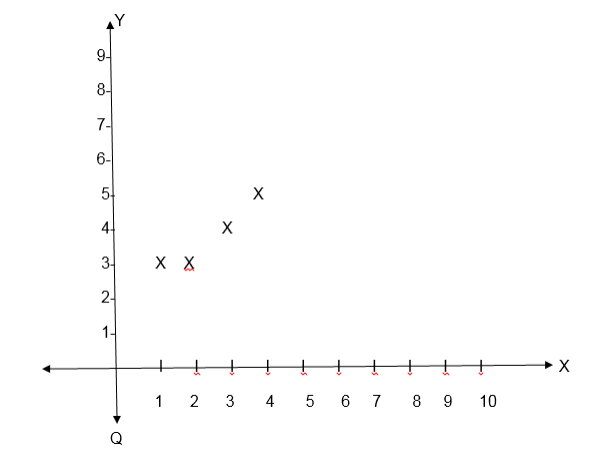
Given
a relation between two sets of numbers, a graph of the relation is
obtained by plotting all the ordered pairs of numbers which occur in the
relation
Note that some relations have graphs representing special figures like straight lines or curves.
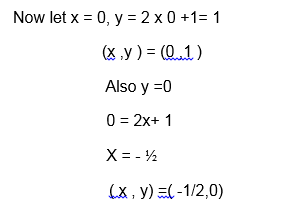
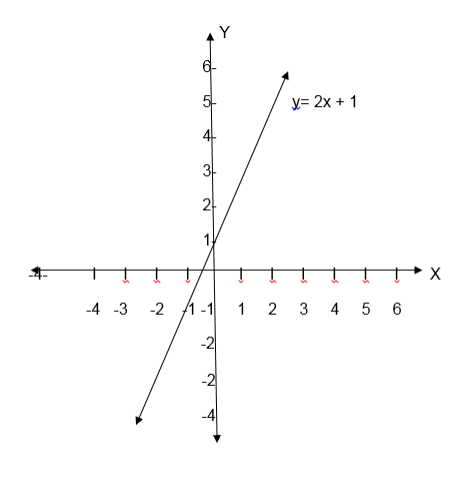
Example 6
The
equation y = 2x +1 represents a straight line, this line passes throng
uncountable points. To draw its graph we must have at least two points
through which the line passes.
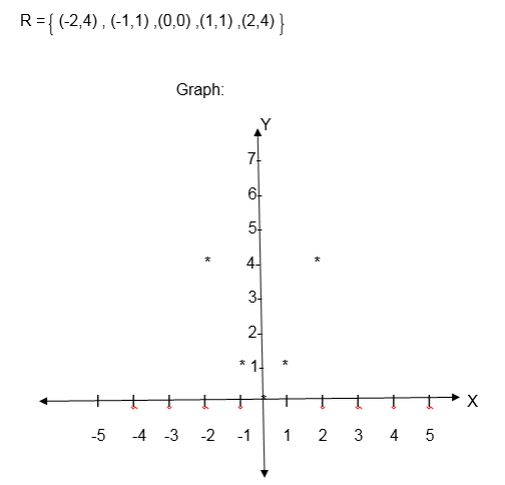
Example 7
Let the relation R be y= x2, where x ∈A and y∈B. Draw the graph of R
NB:
When the relation is given by an equation such as y = f (x), the domain
is the set containing x- values satisfying the equation and the range
is the set of y-values satisfying the given equation.
Exercise 3
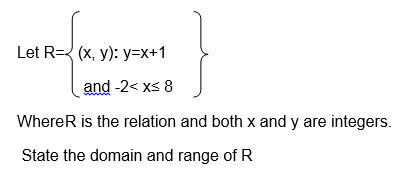
The Domain of Relation
State the domain of relation
The domain of a function is the set of all possible input values (often
the “x” variable), which produce a valid output from a particular
function. It is the set of all real numbers for which a function is
mathematically defined.
The range is the set of all possible output values (usually the
variable y, or sometimes expressed as f(x)), which result from using a
particular function.
R is the relation on two sets A and B such that set A is an independent
set while B is the dependent set, then set A is the Domain while B is
the Co-domain or Range.
Note
that each member of set A must be mapped to at least one element of set
B and each member of set B must be an image of at least one element in
set A.
Y ={2, 4, 6, 8}
x > y x is greater or than y etc
If
the inequality involves two variables it is treated as an equation and
its graph is drawn in such a way that a dotted line is used for > and
< signs while normal lines are used for those involving ≤ and ≥.
region satisfying the given inequality is shaded and before shading it
must be tested by choosing one point lying in any of the two regions,
Example 10
Solution:
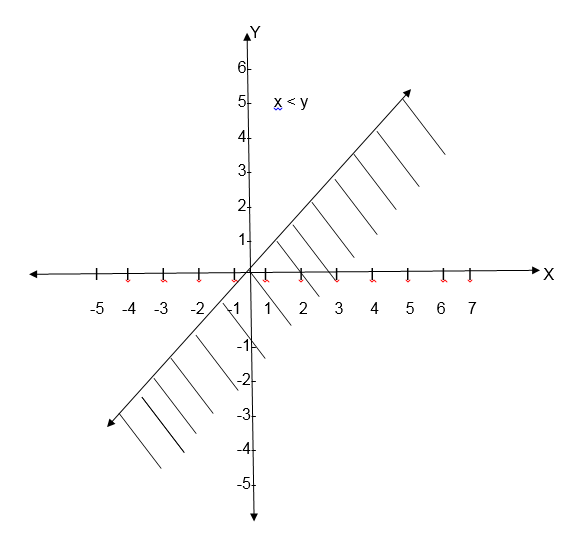
If you draw a graph of the relation R = {(x,y ) : x < y} , the same line is draw but shading is done on the upper part of the line.
Exercise 5
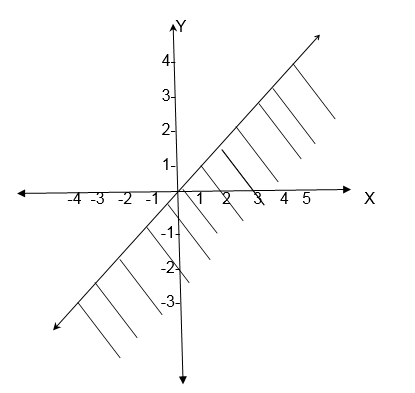
2 .Draw the graph of the relation R = {( x ,y ) : x – y ³ -2}
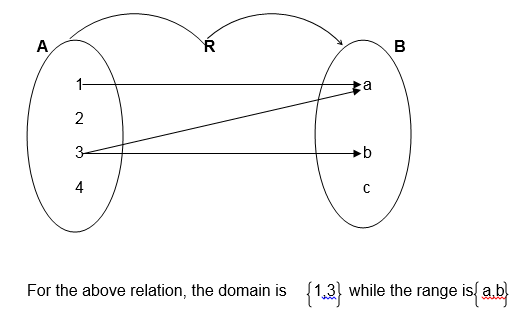
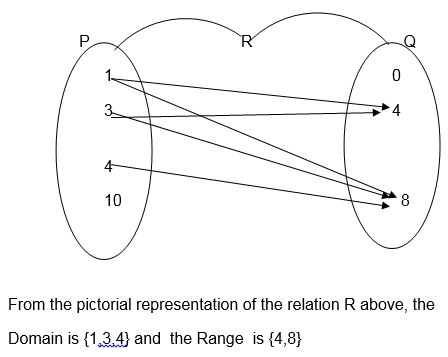
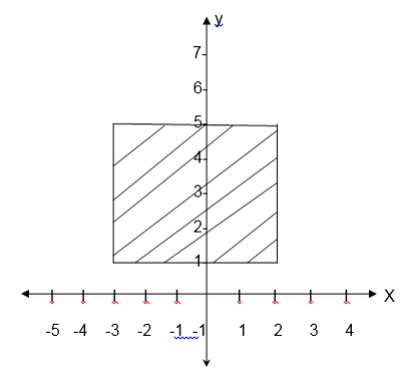
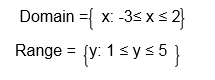
Domain and Range from the graph
Example 11
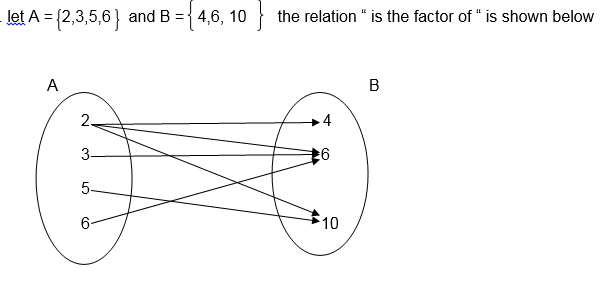
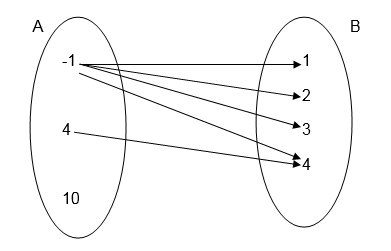
The Inverse of a Relation Pictorially
Explain the Inverse of a relation pictorially
If there is a relation between two sets A and B interchanging A and B gives the inverse of the relation.
- If the relation is shown by an arrow diagram then reversing the direction of the arrow gives its inverse
- If the relation is given by ordered pair ( x, y) , then inter changing
the variables gives inverse of the relation, that is (y,x) is the
inverse of the relation. So domain of R = Range of R -1 and range of R =
domain of R-1
Find inverse of a relation
Example 14
Solution
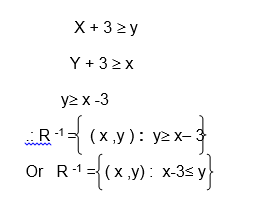
Find the inverse of the relation
TOPIC 1: RELATIONS ~ MATHEMATICS FORM 3
Exercise 6
.Let A = 3,4,5 and B ‘= 1,4,7 find the inverse of the reaction “ is
less than “ which maps an element from set A on to the element in set B
2 .Find the inverse of the relation R = {( x ,y ) : y > x – 1}
5. State the domain and range of the inverse of the relation given in question 1 above.
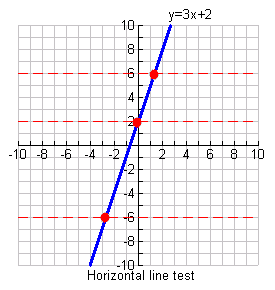
ANY horizontal line intersects your original function in ONLY ONE
location, your function has an inverse which is also a function.
The functiony= 3x+ 2, shown at the right, HAS aninverse functionbecause it passes the horizontal line test.